Measures of success
GRDC invests on behalf of Australian grain growers to improve the profitability and sustainability of the Australian grains industry across a diverse portfolio that spans regions, farming systems, timeframes and crop types. Aligned to values of transparency and accountability, measuring GRDC’s performance and impact allows for ongoing assessment of the benefit and value of grains research development and extension (RD&E) investment to growers, the Australian grains industry, communities and the broader economy.
GRDC’s RD&E investment portfolio is complex, with short, medium and long-term investments over many scientific disciplines. GRDC’s stakeholders are diverse and include growers, researchers, government and the broader community, who may have differing needs, expectations and requirements.
For example, levy payers are generally interested in the impact of RD&E outcomes on their farming business or within their region. Other stakeholders may be interested in macroeconomic performance indicators, such as the contribution of RD&E to environmental and social outcomes.
Assessment of GRDC’s performance and impact is critical to monitor the execution of the RD&E plan, facilitates planning for future R&D investments, offers insight around return on investment, and demonstrates accountability for grain grower and public money.
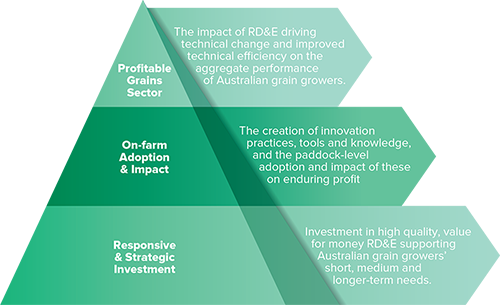
GRDC’s Performance and Impact Framework is segmented into three broad areas measuring GRDC’s investment level impact; the on-farm adoption and impacts of investment outputs; and ultimately, cumulative impacts aggregated at a grains sector level.
RD&E 2023-28 Plan Key Performance Indicators
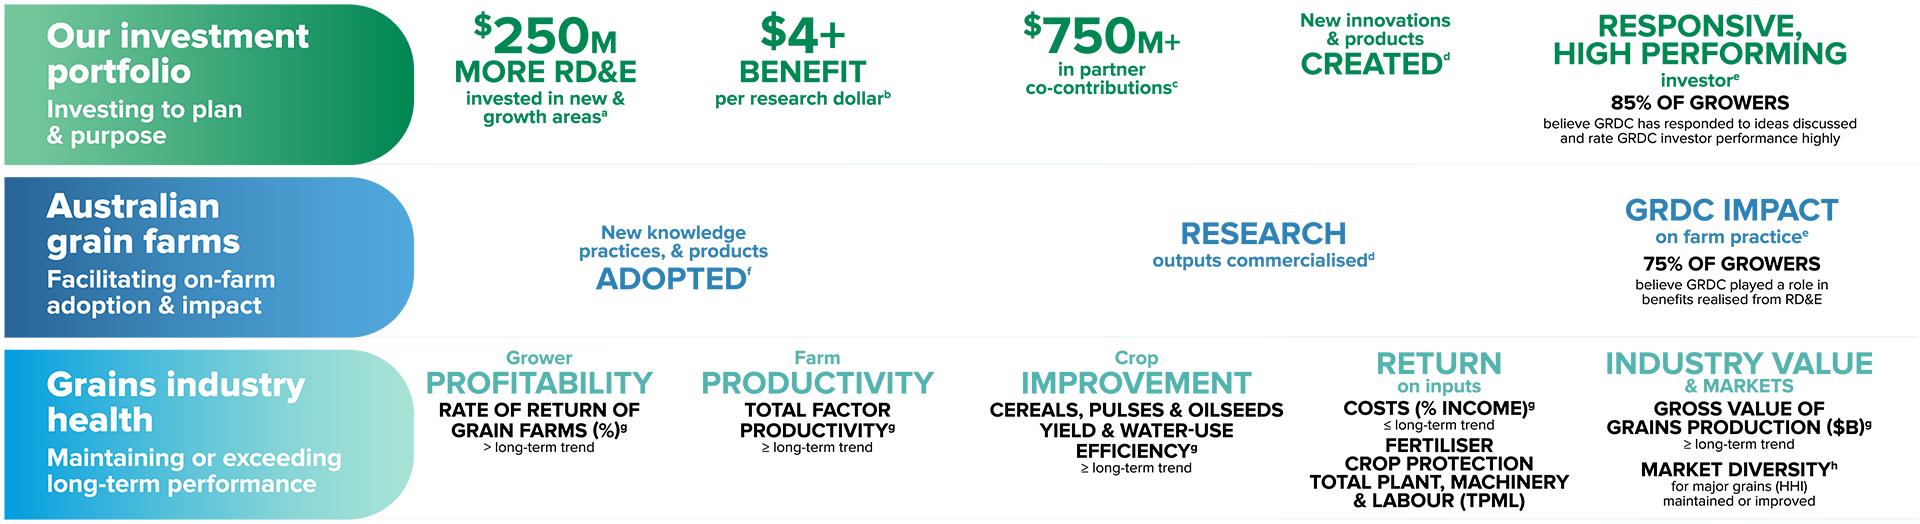
Download the Key Performance Indicators Infographic to view the full image.
a. Comparison to previous plan expenditure. Growth and new areas defined as investment to Reach new frontiers, Grow markets and capture value and Thrive for future generations, with adjustments captured through the Annual Operating Plan.
b. Weighted average estimated return, measured through ex-ante benefit cost analysis for GRDC research investments >250k total contract value where a meaningfully benefit: cost analysis can be generated.
c. Total co-contributions through research partnerships undertaken by GRDC across life of the plan. Includes cash, in-kind and equity. Excludes service agreements.
d. Key research highlights that demonstrate tangible outputs and impact of RDE investment captured through case studies, including new patents, varieties, and technology licenses. Use of ex-post impact analysis where appropriate.
e. Captured through GRDC longitudinal grower surveys across life-of-plan.
f. Transfer of new knowledge and change in adoption of practices and products across life-of-plan, captured through GRDC longitudinal farm practices survey or other methods to quantify.
g. Comparison to long-term national trends using 7-year rolling average (1990-2022). ROR reported as national average and for top 20% (profitability). TFP refers to % change in climate adjusted total factor productivity index. Yield measured through comparison of national yield and water-use efficiency trends for cereals (wheat, barley, oats), legumes (chickpeas, faba beans, lupins, lentils) and canola weighted by crop area planted. Gross value of production adjusted for hectares planted.
h. Herfindal-Hirschman Index (HHI) as indicator of market concentration. Comparison to 10-year average using 7-year rolling average for wheat, barley, sorghum, canola and lentil.