Grains industry

Current state of the industry
It is an exciting time for the Australian grains industry. The long-term demand outlook for grain is strong, with much of this coming from population growth and rising wealth here in Australia and from markets on our doorstep – with South-East Asia and South Asia presenting key export growth opportunities.
Globally recognised for its efficiency, with strong safety and quality credentials, and close proximity to expanding markets, the Australian grains industry is well placed to realise market growth opportunities over the coming decades.
Grain growers are the foundation of the industry, both its historic and future success. They are innovative, efficient and readily embrace new practices, tools and technologies made possible through research development and extension (RD&E) investment by GRDC and others. Farming practices continue to evolve and Australian growers have demonstrated a proven ability to adapt.
Despite farming in one of the world’s driest, most variable climates, on some of the most ancient soils on the planet, the water-use efficiency and yield of Australia’s major crops continues to improve. Transpiration efficiency of plants has been improved and proportion of rainfall transpired increased(14) , meaning growers make better use of the rainfall they receive.
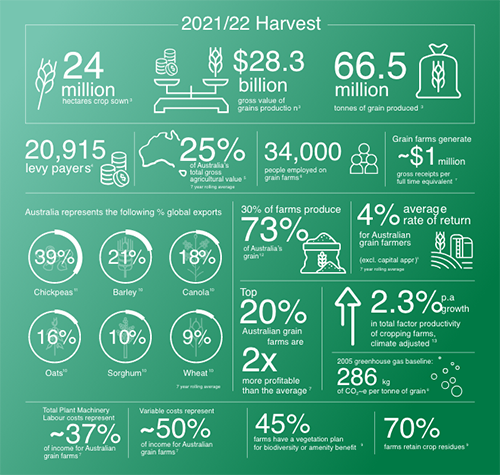
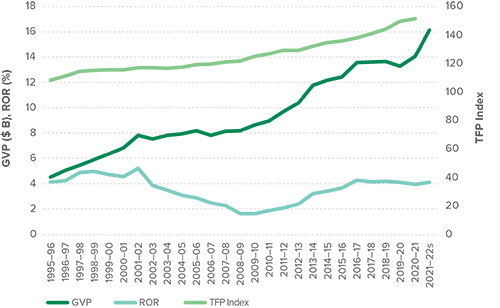
While subject to fluctuating world grain markets and variable seasons, both the gross value of production and climate adjusted total factor productivity of grain farms continue to trend upwards.
Farmers are often the best placed to develop the innovations. Early innovations have stood the test of time.
Australian grains industry long-term performance

s- ABARES estimate. Notes - latest TFP data available to 2020-21 and is climate adjusted, ROR excludes capital appreciation.
Despite the gains delivered through historic RD&E, the grains industry continues to face challenges, perhaps the greatest being risks posed by weather, markets and ongoing access to talent. The seven-year rolling average rate of return for all grain farms, excluding capital appreciation, sits at around 4 per cent, continually challenged by increasing costs of production. Climate change presents a strong headwind to higher, more consistent crop yields. Natural disasters and extreme weather events will continue to test Australian agriculture and communities. Environmental, social and governance (ESG) investment criteria and decarbonisation of the global economy is leading to changes in energy markets, effecting access to capital and markets and influencing farm practices. Variable seasonal conditions and tight profit margins require effective cost management and business models that enable profit opportunities to be realised in the good years, while minimising financial loss in less favourable seasons. These factors, along with changing diets, consumer preferences and community expectations will increasingly impact how growers farm in the future.
But with challenge comes opportunity. New science and technologies can enable the discovery and deployment of new solutions for Australian grain growers. Biotech, fintech and agtech are advancing rapidly and have capability to deliver the next agricultural revolution. The opportunities are endless but to prioritise RD&E investment it is critical GRDC understands the challenges and opportunities facing growers today and anticipate those of the future, through consideration of the trends and drivers expected to shape the grains industry.
3. ABARES estimate, 2021/22. ABARES 2023, Agricultural commodities: March quarter 2023, Australian Bureau of Agricultural and
Resource Economics and Sciences, Canberra, March CC BY 4.0. https://doi.org/10.25814/5sb3-qm40
4. GRDC. (2023). Grains Levy Payer Register. Confidential (unpublished). Note: Based on unique ABNs with a total value of production >$40k.
5. ABARES, 7-year rolling average 2015/16-21/22. ABARES 2023, Agricultural commodities: March quarter 2023, Australian Bureau of
Agricultural and Resource Economics and Sciences, Canberra, March CC BY 4.0. https://doi.org/10.25814/5sb3-qm40
6. ABARES 2022, Downham, R & Litchfield, F 2022, Labour use in Australian agriculture: Analysis of survey results, 2021–22, Canberra,
December. CC BY 4.0. https://doi.org/10.25814/vmpb-xm51
7. Agripath., Farmanco., Pinion Advisory., and Planfarm (2022). National benchmarking snapshot report 2018-2020 (unpublished).
Note: impacts of drought.
8. CSIRO (2023) Revised GHG baseline (preliminary) as amendment to CSIRO Australian Grains Baseline and Mitigation Assessment Report 2022. Unpublished. Sevenster M., Bell L., Anderson B., Jamali H., Horan H., Simmons A., Cowie A., Hochman Z. (2022). Australian Grains Baseline and Mitigation Assessment. Main Report. CSIRO, Australia
9. Umbers, A. (2021). GRDC Farm Practices Survey Report 2021. Down to Earth Research. https://grdc.com.au/resources-and-publications/all-publications/publications/2022/grdc-farm-practice-survey
10. USDA, 7-year rolling average 2015/16-21/22. United States Department of Agriculture (USDA), 2023. Downloadable data sets.
Foreign Agricultural Service. PSD Online. https://apps.fas.usda.gov/psdonline/app/index.html#/app/downloads
11. FAO, 7-year rolling average 2015-21. Food and Agriculture Organisation (FAO) FAOSTAT (2023) Food and Agriculture Organization of the United Nations (FAO). FAOSTAT Database. https://www.fao.org/faostat/en/#data
12. ABARES 2022, Disaggregating farm performance statistics by size, 2020–21 data dashboard, Australian Bureau of Agricultural and
Resource Economics and Sciences, Canberra, June. CC BY 4.0. https://doi.org/10.25814/jd80-tr67
13. ABARES, 2015-21, Farm Data Portal – Beta, 2023 data dashboard, Australian Bureau of Agricultural and Resource Economics and
Sciences, Canberra, February. Updated 7/03/2023. https://www.agriculture.gov.au/abares/data/farm-data-portal
14. Harries, M., Flower, K.C., Renton, M., and Anderson, G.C. (2022). Water use efficiency in Western Australian cropping systems.
Crop and Pasture Science, 73 (10), 1097-1117. https://doi.org/10.1071/CP21745
15. ABARES, 7 year rolling average 1995/96 -2020/21, Farm Data Portal - Beta, 2023 data dashboard, Australian Bureau of Agricultural and Resource Economics and Sciences, Canberra, February. Updated 7/03/2023. https://www.agriculture.gov.au/abares/data/farm-data-portal